
Spotting a stock breakout before it happens is something that every trader would wish to know, but it’s not as simple as it sounds. Patterns and signals on stock charts often give clues, but reading them takes patience and skill. If you’ve ever wondered whether it’s possible to see a breakout in advance, you’re not alone.
In this article, we’ll discuss practical ways to identify potential breakouts before they occur.
Can Breakouts Be Predicted?
Predicting breakout stocks is possible for traders who study price patterns, volume shifts, and market sentiment in detail. While nothing guarantees future performance, experienced market watchers can often spot signs of momentum building beneath key resistance or support levels.
Patterns such as consolidation phases, sudden volume increases, and repeated tests of price barriers suggest that a breakout may be near.
By combining technical analysis with close observation, it becomes feasible to anticipate a breakout before the actual move happens. Now, let’s try to find out how breakouts can be predicted.
Tools & Methods for Early Detection
To spot breakouts before they happen, traders use a mix of technical tools and market insights that help reveal early signs of a possible move.
1. Technical Indicators
Technical indicators serve as early signals for potential stock breakouts. Moving averages like the 50-day and 200-day help traders assess the underlying trend, revealing momentum shifts when prices approach key resistance.
The Relative Strength Index can indicate when buying interest is building, even before the broader market reacts.
By using these indicators together, traders can spot subtle changes in market sentiment, positioning themselves ahead of major moves rather than reacting after a breakout happens.
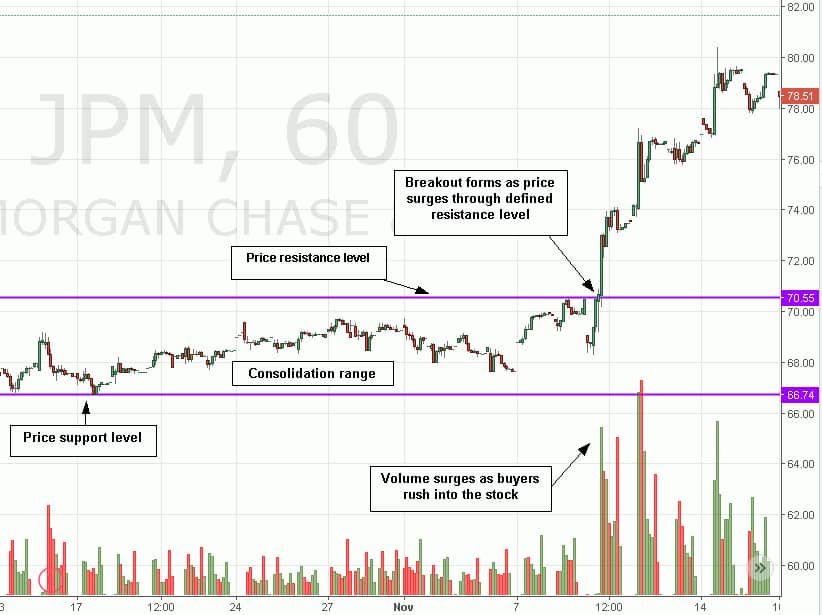
2. Volume Analysis
Volume analysis is key to understanding market interest in a stock. When trading volume increases as a stock nears resistance, it often signals that buyers are actively accumulating shares.
Even small rises in volume during sideways price movement can reveal hidden demand building up. This growing participation usually precedes significant price moves.
Paying attention to volume patterns helps traders differentiate between weak attempts and genuine breakout setups, improving timing and decision-making.
3. Price Patterns and Chart Formations
Certain patterns have a history of preceding breakouts. These price patterns form when a stock’s price moves within narrowing boundaries, signaling a buildup in momentum. For example, a symmetrical triangle pattern shows price consolidating between converging trendlines.
As the price nears the triangle’s apex, the likelihood of a breakout increases. Traders watch for a decisive move above the upper trendline, confirming the breakout and often leading to significant price gains. Recognizing such formations helps anticipate potential market moves.
4. Using Screeners and Alerts
Many traders rely on a free stock screener to identify potential breakout candidates quickly. These tools allow filtering stocks based on criteria like price near resistance levels or rising volume.
By setting alerts for these conditions, traders receive timely notifications, enabling them to monitor promising setups without constant manual checks. Combining screeners with personal analysis improves decision-making and helps act early.
Using this approach, traders can efficiently spot stocks showing signs of imminent breakouts before the wider market reacts.
5. Market News
Market news plays a crucial role in triggering stock breakouts. Events such as earnings reports, product launches, or major partnerships can create sudden buying interest that pushes prices above resistance levels.
Traders who monitor these developments can anticipate moves before they fully unfold. Staying informed on company updates and industry trends helps identify potential breakout opportunities driven by factors beyond just technical signals.
Conclusion
While no method guarantees spotting breakouts before they occur, combining technical tools with market insight improves your chances. Staying alert to price patterns, volume shifts, and news can help. Remember, careful risk management is key to navigating false signals and making informed trading decisions.